QGML Visualization Gallery
This page showcases the visualizations and analysis results generated by the QGML framework.
Advanced Quantum Geometry Analysis
The following visualizations were generated by running the geometric analysis demo, which demonstrates the advanced quantum geometry features of QGML including topological analysis, quantum information measures, and comprehensive geometric analysis.
Comprehensive Analysis Visualization
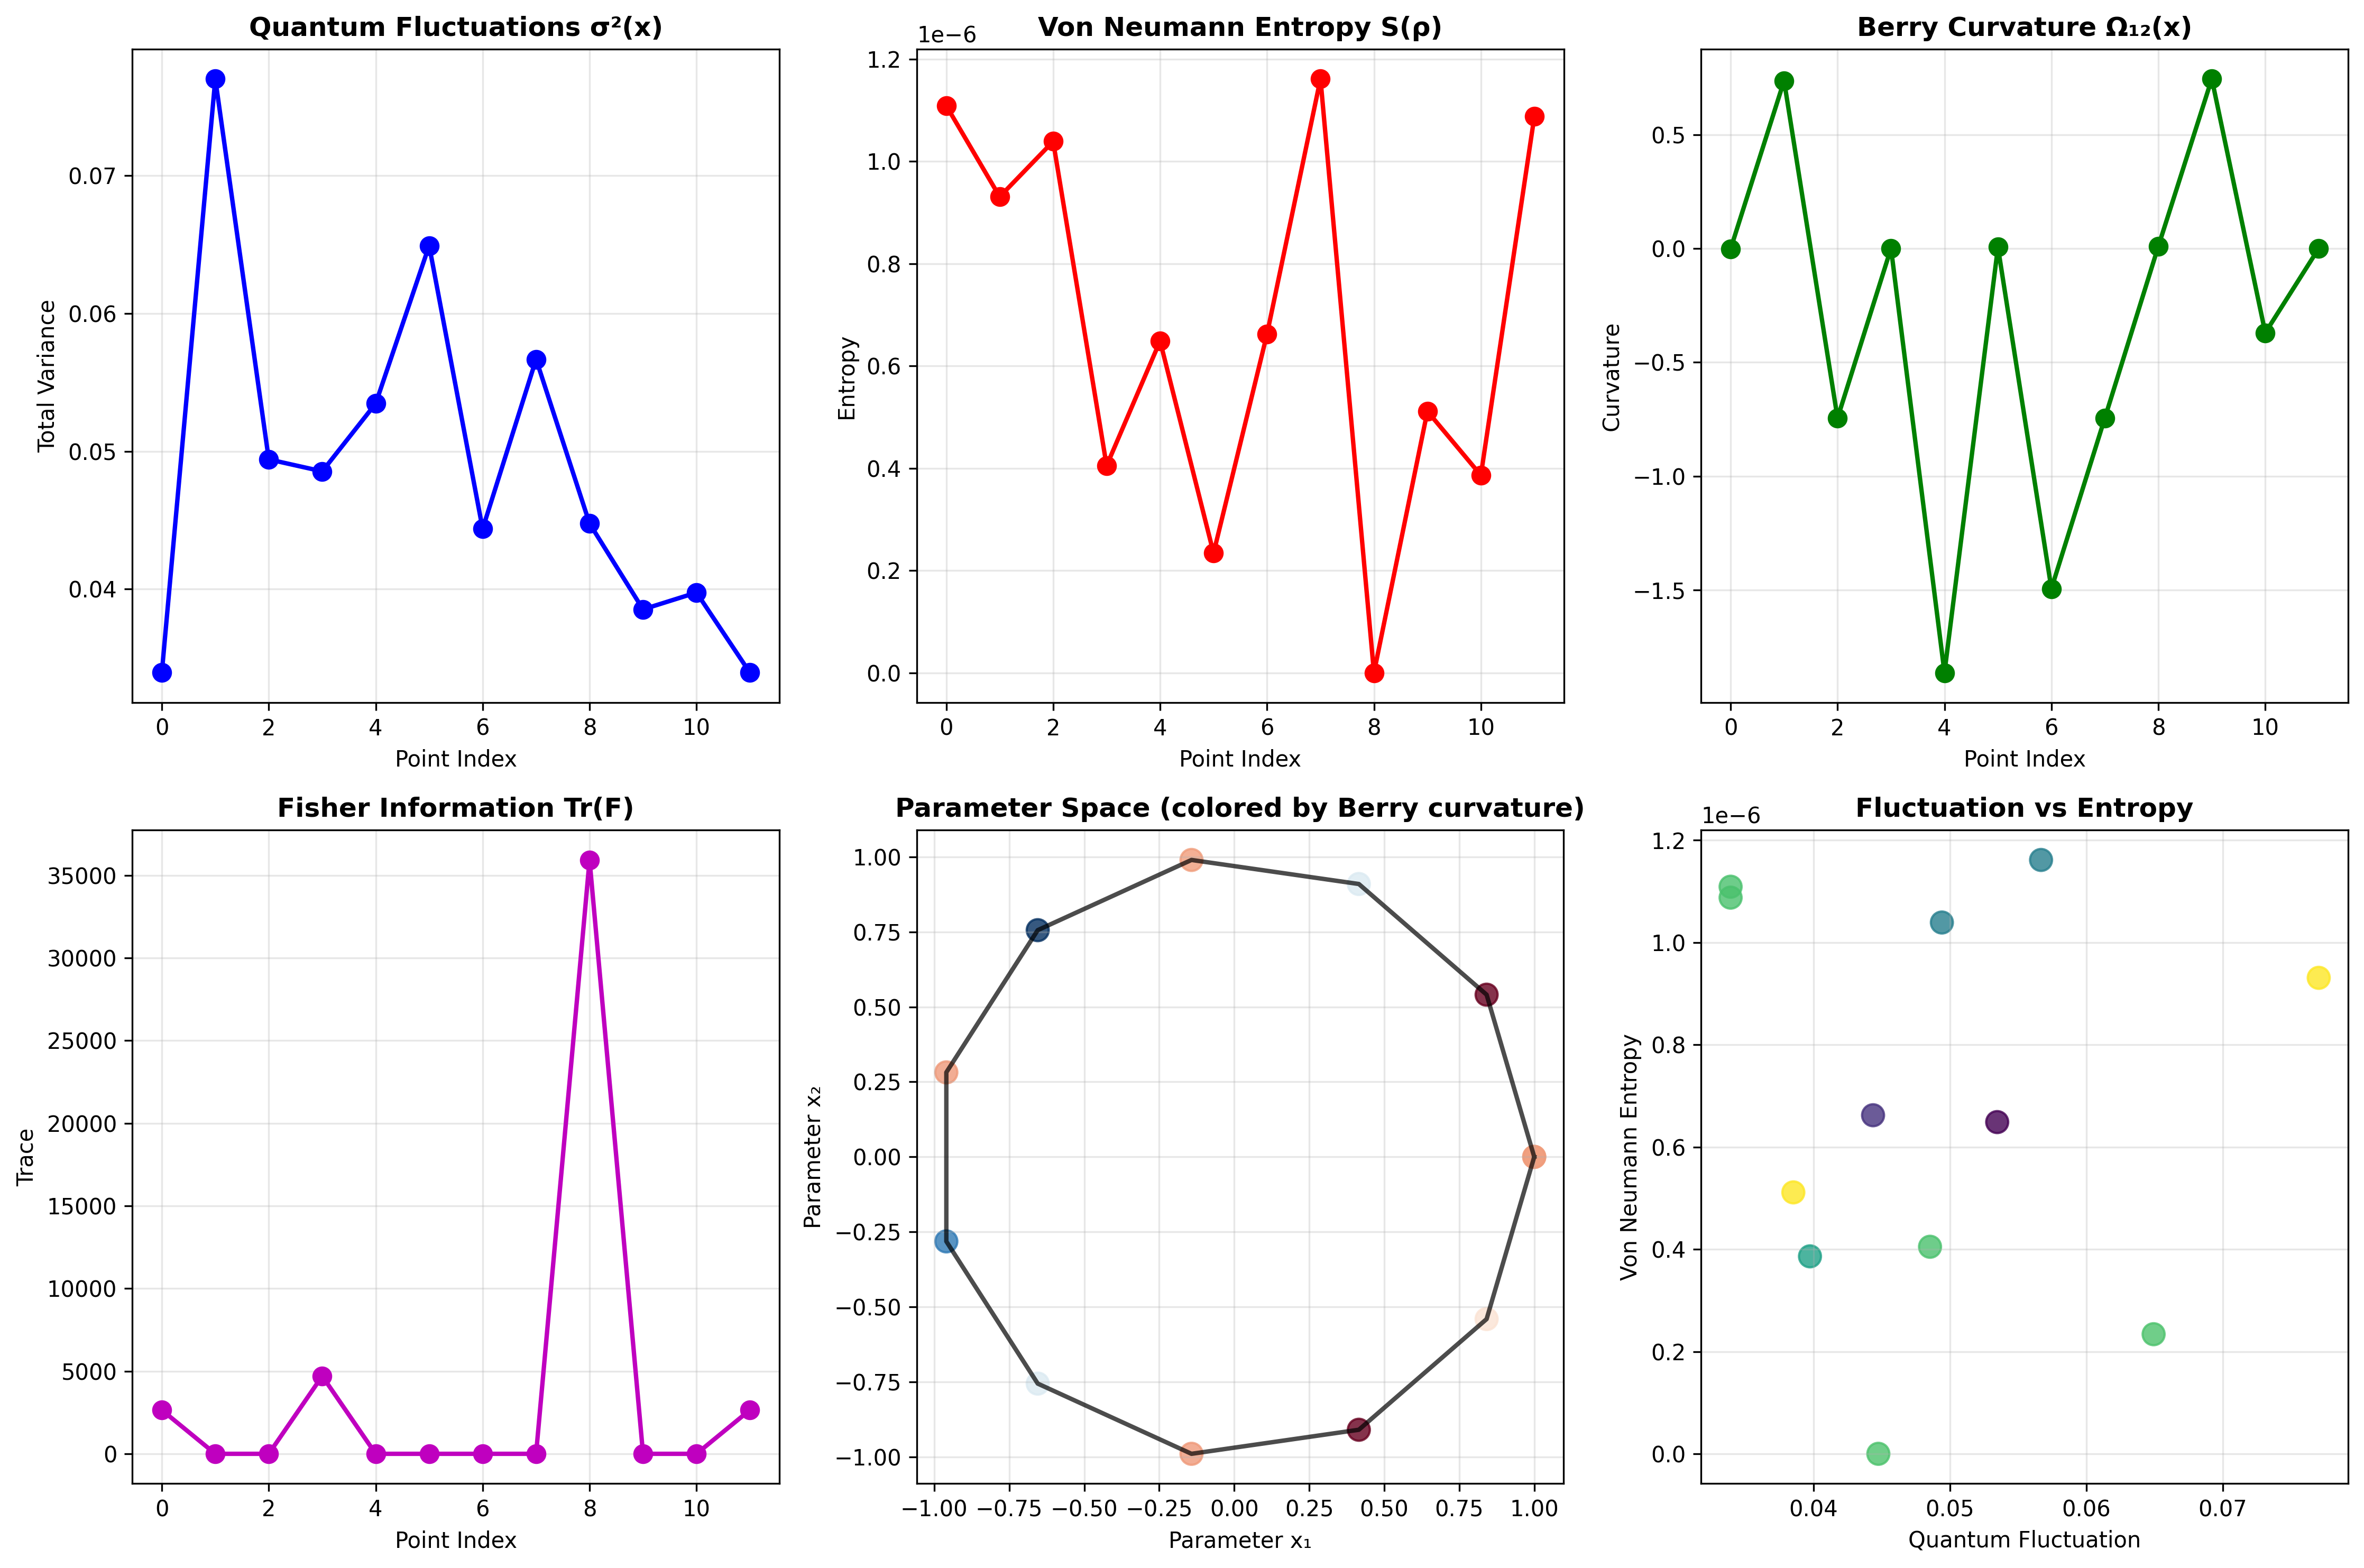
This comprehensive visualization shows six key aspects of quantum geometric analysis:
Quantum Fluctuations σ²(x): Total variance in quantum states across parameter space
Von Neumann Entropy S(ρ): Quantum information content of the density matrix
Berry Curvature Ω₁₂(x): Topological curvature in parameter space
Fisher Information Tr(F): Quantum Fisher information matrix trace
Parameter Space Trajectory: 2D parameter space colored by Berry curvature
Correlation Analysis: Relationship between quantum fluctuations and entropy
Topological Analysis
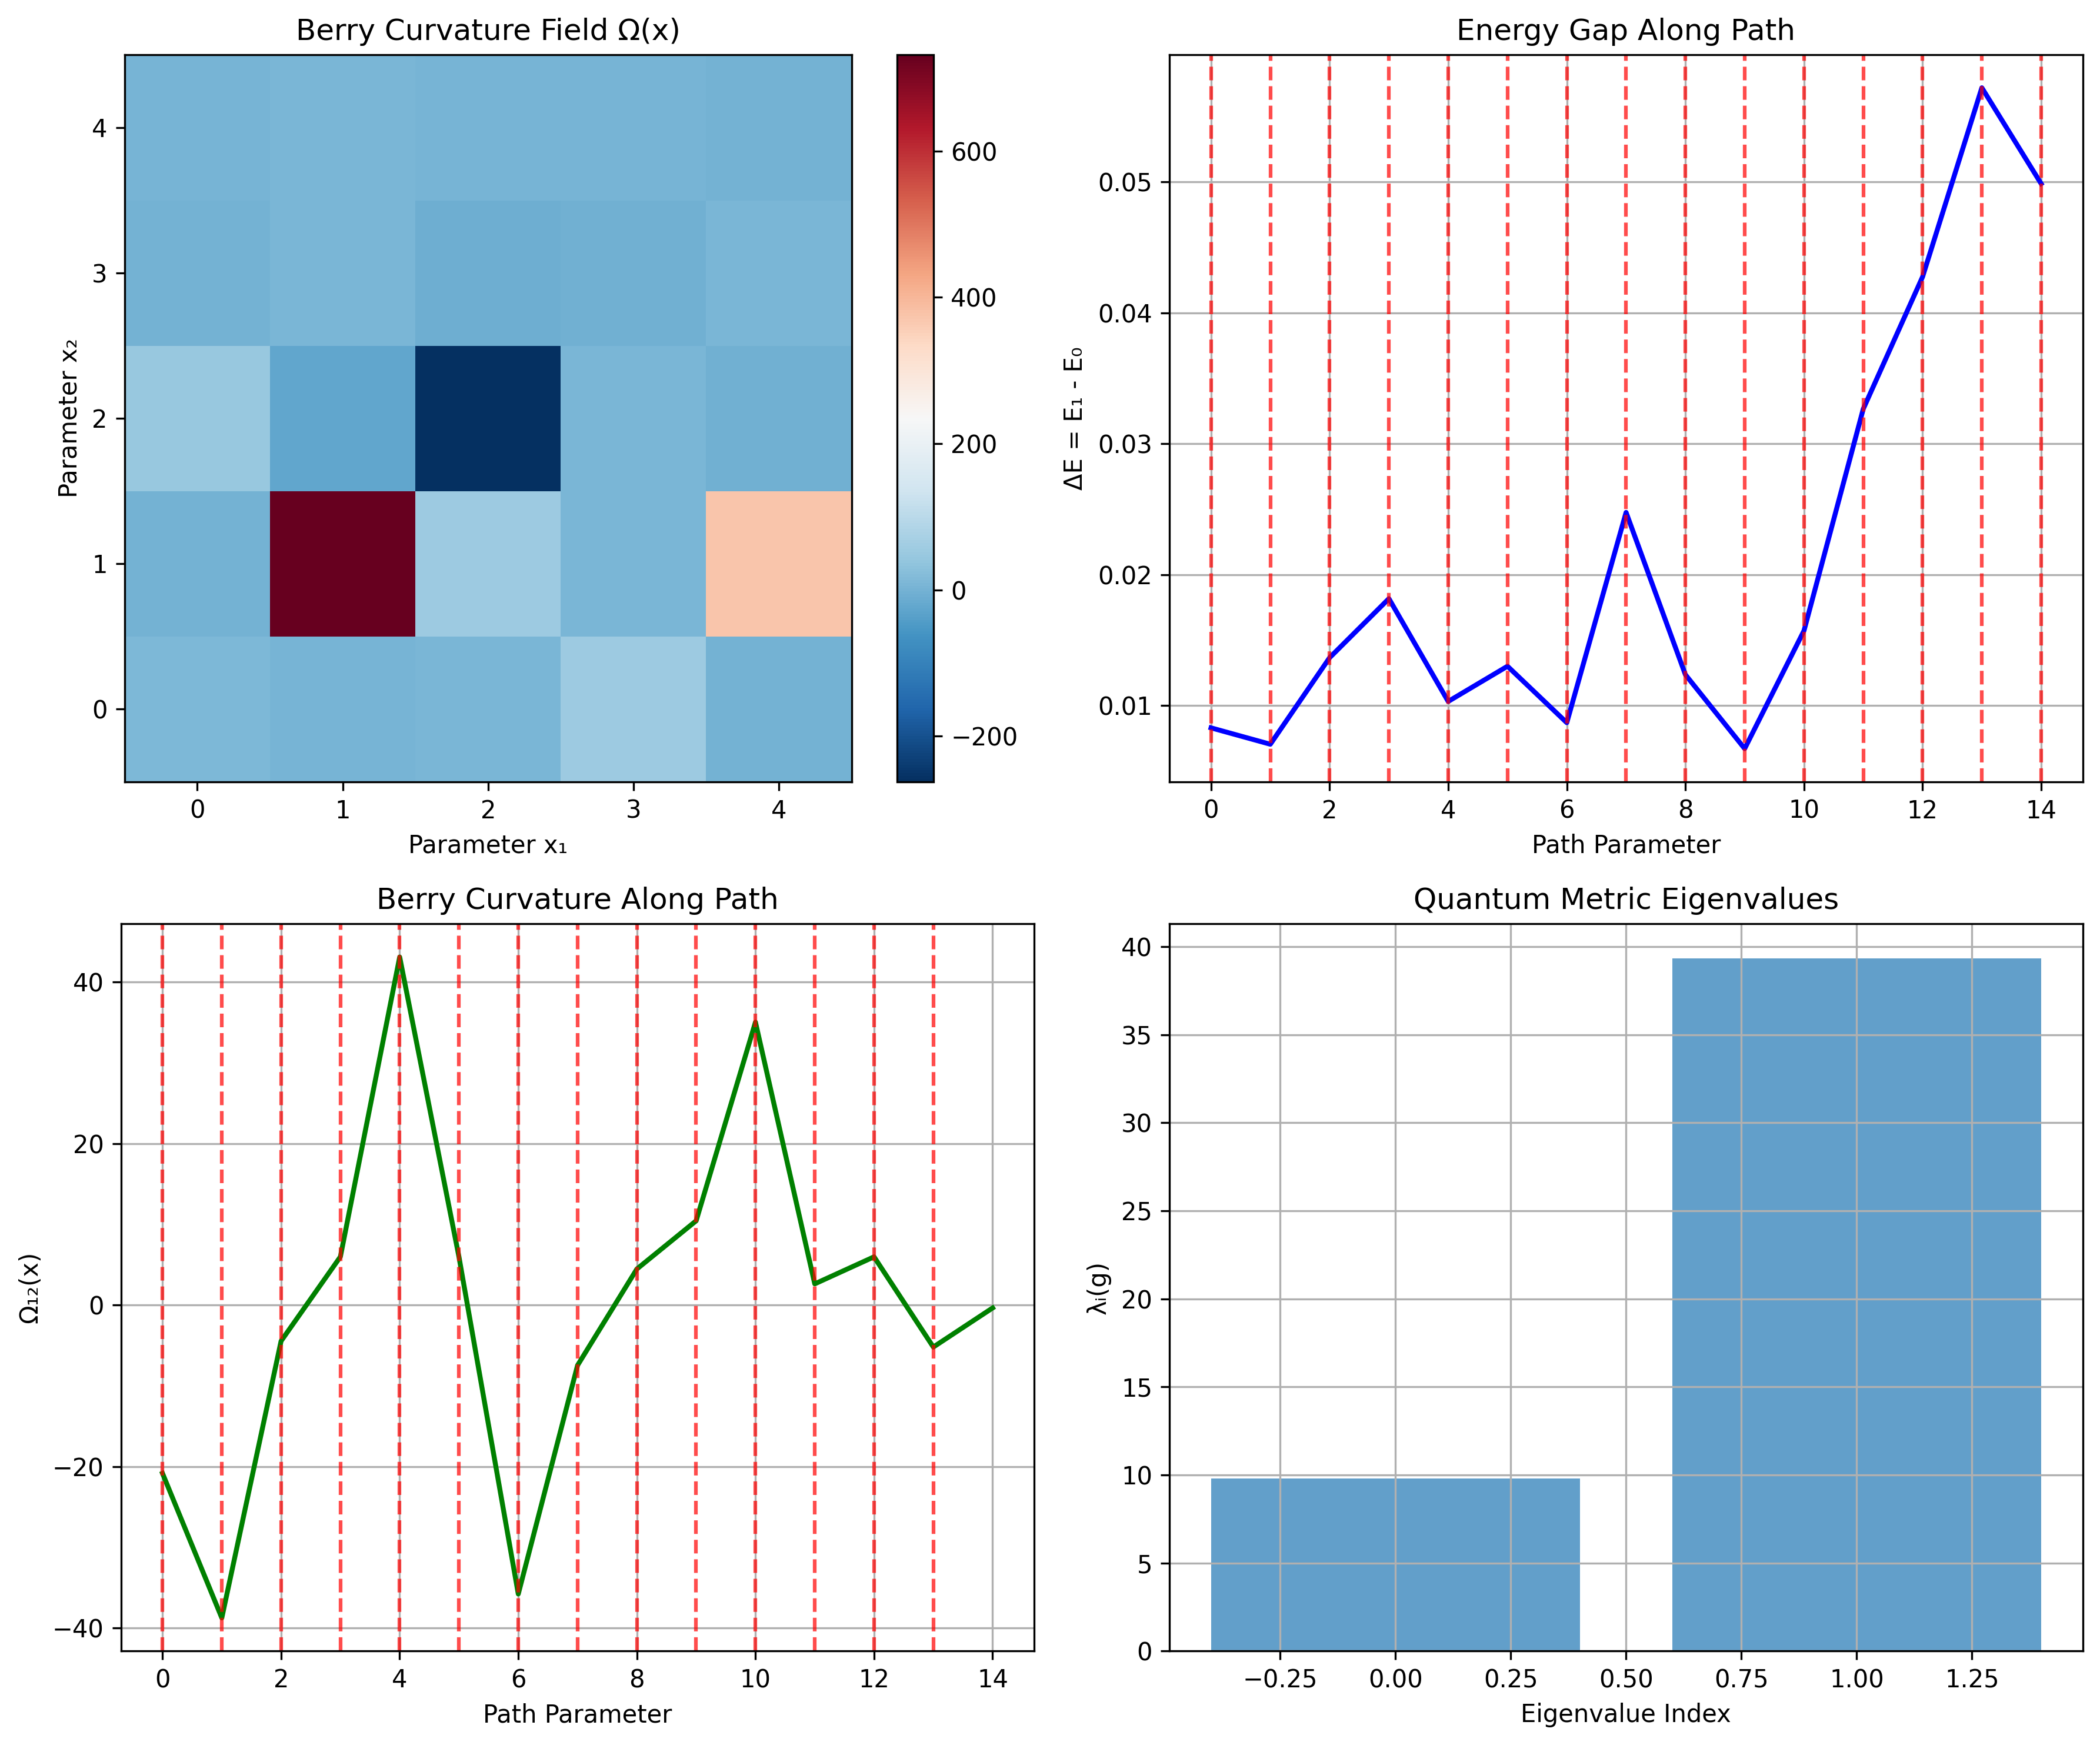
This visualization demonstrates the topological properties of the quantum system:
Berry Curvature Field: Spatial distribution of topological curvature
Chern Numbers: Topological invariants computed around closed paths
Phase Transitions: Detection of quantum phase transitions in parameter space
Topological Charge: Local topological properties
Analysis Results Summary
Key Results from Geometric Analysis Demo
Topological Analysis: - Berry curvature at sample point: 34.29 - Chern number around circle: 1.42 - Detected 28 phase transitions - Topological charge: 1.37
Quantum Information Measures: - Von Neumann entropy: 0.000002 - Entanglement entropy: 0.644 - L1 coherence: 4.58 - Relative entropy coherence: 2.20 - Information capacity: 0.000001 - Effective dimension: 1.000002
Berry Curvature Field: - Field computed on 8×8 grid - Mean curvature: 0.18 - Standard deviation: 3.16
Complete Analysis Pipeline: - Parameter dimension: 2 - Hilbert dimension: 8 - Sample Berry curvature: -20.86 - Quantum metric trace: 49.13
Technical Details
The visualizations were generated using:
Framework: QGML (Quantum Geometric Machine Learning)
Backend: PyTorch
Hilbert Space Dimension: 8
Parameter Space Dimension: 2
Analysis Points: 12-20 points for comprehensive analysis
Grid Resolution: 8×8 for Berry curvature field
The analysis demonstrates QGML’s capability to:
Encode classical data in quantum states using geometric principles
Compute topological invariants like Berry curvature and Chern numbers
Analyze quantum information through entropy and coherence measures
Detect phase transitions in parameter space
Visualize complex relationships between geometric and information-theoretic properties
Next Steps
These visualizations provide a foundation for:
Real-world applications: Testing on biological, financial, or scientific datasets
Scalability analysis: Extending to higher-dimensional parameter spaces
Hardware implementation: Porting to quantum computing platforms
Advanced correlations: Exploring deeper relationships between topology and information
For more detailed analysis results, see the JSON files in the test_outputs directory.